The QWERTY Effect, demonstrated in Jasmin & Casasanto, 2012, Psychonomic Bulletin and Review, is a subtle but reliable association between the way words are typed on the QWERTY keyboard and their emotional valence. Across 3 experiments, Jasmin and Casasanto found that words spelled with more letters from the right side of the keyboard were, on average, more positive in meaning than words spelled with more letters from the left side (i.e., there was a positive association between the words' Right Side Advantage (RSA) and their emotional valence ratings).
In his blog post on the Language Log (March 8, 2012), Mark Liberman denounced our study, calling the reliability of the results into question. This is our reply.
Is the QWERTY effect robust, or did the authors report a false positive result? Replication is the best protection against false positives. In our paper, we replicated the effect 6 times, in 5 different corpora (one of which we divided a priori into two parts), in 3 languages and a large corpus of pseudowords. Subsequently, we replicated the effect again in a 6th corpus, in a 4th language.
[Note: Scientists who are used to looking at graphs, you might want to skip straight to the plots of the permutation tests showing the reliability of these effects, below (fig. 1a-j). These plots show the frequencies of permuted r-values compared to the observed r-value for each of the tests mentioned above. These are simple regression analyses on raw data, controlling for nothing. They tell the whole story, and show that the observed effects are extremely unlikely to have occurred by chance, over and over and over and over...]
We'll add that we even find the QWERTY effect in the Dodds et al. corpus, which Liberman posted as a "failure to replicate" our effect, when the analysis is controlled appropriately - showing that the effect still holds (weakly but significantly) for a peculiar corpus in which a "word" is defined as "any contiguous set of characters bounded by white space and/or a small set of punctuation characters" - demonstrating the QWERTY effect in a 7th corpus, for an 8th time.
Liberman attempted to discredit our results in 4 ways:
1. He ran a simple regression of Valence on Right Hand Advantage (RHA) for one of the five corpora we used, and reported that the "multiple adjusted r2" was not significant.
2. He did a permutation test with three iterations, and showed that, in one of the three permutations, the permuted effect was almost as big as the real observed effect.
3. He said things that simply aren't true, like that he "didn't have access" to the corpora we analyzed, and he made groundless insinuations, suggesting that our experiments were susceptible to the problems discussed in the False Positives paper by Simmons et al. (How?)
4. He posted a "failure to replicate" the QWERTY effect in a large but peculiar corpus of English "words."
We'll address each of these, as briefly and respectfully as possible.
1. Liberman reports a confusing statistic.
Liberman reports that he ran a simple regression of Valence on RHA in English ANEW, and that the "multiple adjusted r2" was not significant. Why report a "multiple adjusted r2" for a simple regression?
The adjusted r2 is almost always smaller than plain-old r2, which is probably why Liberman decided to report it. However, using "multiple adjusted r2" only makes sense in multiple regression models - that is, in models with multiple explanatory variables. In a simple regression with one "x" and one "y," however, there is only one explanatory variable, so the multiple adjusted r2 is virtually meaningless, and reporting it is highly non-standard. r2 (the square of Pearson's r) is standard.
What happens if you test for the significance of the effect of RSA on Valence in a simple regression using an appropriate measure (i.e., Pearson's r)? Well, that shows a significant positive association, just as we predicted (see Figure 1d, below).
2. Three iterations do not constitute a permutation test.
Liberman ran a permutation test with *three* iterations on one of the corpora we analyzed, and showed that, in one of the three permutations, the permuted effect was almost as big as the real effect. On the basis of this "test," he concludes that our results are probably a fluke.
We agree that permutation tests are an excellent way to test the reliability of an effect. However, to run a valid permutation test, one usually iterates the permutation 1,000 or 10,000 times. Liberman iterated his 3 times.
Suppose you flip a coin 3 times, and it comes up "tails" 3 times in a row. Can you conclude that the coin is weighted? Of course not - you can't conclude anything.
Ironically, when Liberman flipped his coin, the outcome supported the QWERTY effect all three times. That is, he never found that the permuted effect was greater than the observed effect in the real data, which makes his conclusion even more nonsensical. If one were to compute the p-value based on these 3 permutations, all of which yielded effects smaller than the observed effect, the p-value would be p=0.0000000(to infinity).
Of course, interpreting this "test" as evidence for the QWERTY effect would be as silly as interpreting it as evidence against it.
What happens if we run interpretable permutation tests - with 10,000 iterations? Below you can see the results of these tests, on all of the data that we reported in the paper, and also on some new data that will be reported in a follow-up paper.
For people unfamiliar with permutation tests, all you do is randomly shuffle the dependent measure with respect to the predictor (so, in this case, the Valence for one word gets randomly paired with the RSA for another), and you see how often the r-value for the randomly shuffled data comes out to be greater than the observed r-value for the real data. This proportion gives you a p-value for the observed r-value, in an intuitive way: A p-value of .001 means that the Randomly Permuted test statistic came out to be greater than the Real Observed test statistic only 10 times out of 10,000 (i.e., 1 in 1000).
Here's what 10,000-iteration permutation tests show for simple regressions on the raw data, controlling for nothing:
EXPERIMENT 1
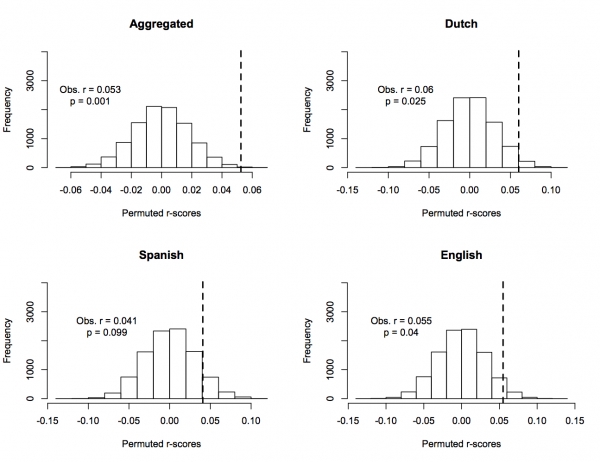
a. All ANEW words (combining English, Dutch, & Spanish): Observed r=0.053, p=.001
b. Dutch ANEW only: Observed r=0.06, p=.025
c. Spanish ANEW only: Observed r=0.041, p=.099
d. English ANEW only: Observed r=0.055, p=.04
EXPERIMENT 2
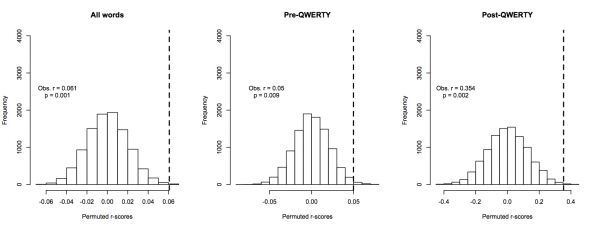
e. All AFINN words (Pre- and Post-QWERTY): Observed r=0.061, p=.001
f. Pre-QWERTY words: Observed r=0.05, p=.009
g. Post-QWERTY words: Observed r=0.35, p=.002
EXPERIMENT 3
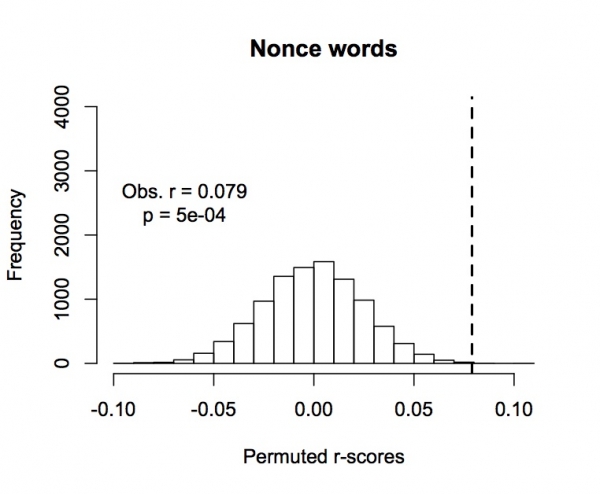
h. All nonce words: Observed r=0.079, p=0.000004
NEW EXPERIMENT (On a corpus published after Jasmin & Casasanto 2012 went to press)
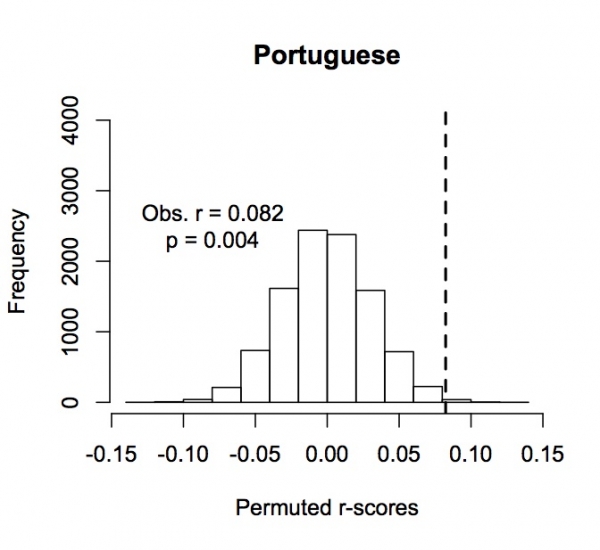
i. European Portuguese ANEW: Observed r=0.082, p=.004
NEW ANALYSIS (On AFINN words (N=2178) that are found in this corpus but not in ANEW)
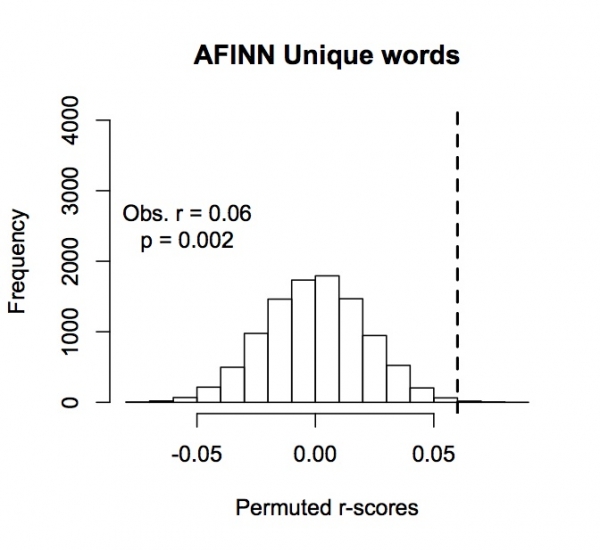
j. Words unique to AFINN (N=2178): Observed r=0.06, p=.002
FIGURES
Experiment 1 - Permutation tests (Fig. 1a-d)
Frequency of permuted r-scores for English, Spanish and Dutch ANEW, and their aggregate. Dotted lines indicate observed values.
Experiment 2 - Permutation tests (Fig. 1e-g)
Frequency of permuted r-scores for all AFINN words, Pre-QWERTY words alone, and Post-QWERTY words alone. Dotted lines indicate observed values.
Experiment 3 - Permutation test (Fig. 1h)
Frequency of permuted r-scores for pseudoword corpus. Dotted line indicates observed value.
Additional Experiment: European Portuguese ANEW - Permutation test (Fig. 1i)
Frequency of permuted r-scores for European Portuguese ANEW. Dotted line indicates observed value.
Additional Analysis: Words Unique to AFINN (not in English ANEW) - Permutation test (Fig. 1j)
Frequency of permuted r-scores for words in AFINN corpus that are not in English ANEW. Dotted line indicates observed value.
So, to summarize this list, here are 10 tests of the QWERTY Effect, on 6
different corpora, in 4 different languages and a large corpus of nonce
words. They all show the predicted positive relationship between RSA
and Valence. 9 out of the 10 tests produced p-values less than .05. 7
out of 10 tests produced p-values less than .01.
Again, these plots reflect simple regressions of Valence on RSA for the *raw data*, controlling for nothing. Most of these effects get stronger - sometimes much stronger - when you control for Word Length, Letter Frequency, and their interaction. (Lexical frequency data were not available for all of the words - we addressed this issue by running the nonce word experiment, in which all items had lexical frequencies of zero.)
These are 1-tailed p-values. All of the omnibus analyses are highly significant by 2-tailed tests. Are we justified in interpreting 1-tailed tests on the subordinate analyses? Yes, in light of (a) the highly significant effect in the omnibus analyses, and (b) our a priori prediction about the direction of the QWERTY effect, overall. Besides, if you convert everything to 2-tailed tests, there's only one change of consequence: English ANEW goes from p=.04 to p=.08.
As reported in our paper, Spanish ANEW showed a non-significant trend in the same direction as all of the other tests. The Spanish pattern did not differ statistically from the other ANEW tests (i.e., the interaction of Language x RSA did not approach significance), so it would be inappropriate to interpret this result as differing from the others (see paper).
Above we've reported 2 tests that were not in the paper (see figs 1i-j). First, while our paper was in press, a European Portuguese version of ANEW was published. As you can see from fig. 1i, above, the Portuguese ANEW data replicate the pattern found in English, Spanish, and Dutch, and even produce a stronger QWERTY effect than was found in the other 3 languages.
Second, we added an analysis to increase the independence of these various tests of the QWERTY effect. In the ANEW tests that we reported in the paper, words and their translation equivalents were modeled as repeated observations - in this way we correctly accounted for the non-independence of the corresponding words in the three ANEW corpora. So, the model was "informed" that translation equivalents of the same words were being analyzed. Still, arguably, the different versions of ANEW may not be not fully independent (to be conservative, we reported the 3 ANEWs as one experiment). The nonce word corpus was clearly independent of ANEW, so the nonce results constitute an independent validation of the QWERTY effect. AFINN was mostly independent, but there were some words that overlapped with English ANEW. To make sure that the AFINN results constitute another completely independent validation of the QWERTY effect, here we report an analysis of just those words that were found in AFINN but not in ANEW (N=2178 words). Indeed, AFINN-unique words showed a highly significant QWERTY effect (see fig 1j, above).
To summarize this point, these plots of the permutation tests tell a very clear story: the QWERTY effect is robust. It has been replicated many times, in several languages, and is very unlikely to have been found by chance (over and over and over...)
3. Liberman (and other commenters) wrote things that simply aren't true.
Liberman and others who've jumped on his bandwagon have written lots of things in this thread that simply aren't true - most of them can be shown to be false by even a quick read of the paper. We'll mention just a few.
a. In his effort to undermine our credibility, Liberman writes - repeatedly - that he "didn't have access" to the corpora we analyzed. This is not credible. English ANEW, Spanish ANEW, and AFINN, were previously published. Dutch ANEW and our list of pseudowords were published in our 45-page appendix. If any additional materials had been requested, the authors would have been happy to provide them.
b. One of the most enthusiastic commenters, Steve Kass, wrote repeatedly that we never analyzed the English, Spanish, and Dutch QWERTY corpora independently, and he quotes our paper to support this assertion:
[T]hey didn't analyze the three languages separately. They claim this was "neither required nor licensed [sic]," since "there was no significant difference in the strength of the QWERTY effect across languages."
Actually, we did analyze the three languages independently, even though it was not required by the omnibus analyses - but one would have to read our whole paper to find this out. (The paper is only 6 pages long!)
Here's the passage that Kass excerpted, along with the sentences *immediately preceding and following* it. From our paper:
"[L]anguage did not interact with RSA to predict valence [Wald Chi squared=0.23, df=2, p=.89], and the effect of RSA on valence remained significant when the effect of language and the interaction of language with RSA were controlled [B=0.043, Wald Chi squared=5.19, df=1, p=0.02]. Since there was no significant difference in the strength of the QWERTY effect across languages, an analysis of each separate language is neither required nor licensed. With that caveat, we note that the predicted relationship between RSA and valence was significant in English [B=.043, Wald Chi squared=4.61, df=1, p=.03] and in Dutch [B=.051, Wald Chi squared=5.81, df=1, p=.02], and a trend in the same positive direction was found in Spanish [B=.035, Wald Chi squared=1.04, p=.31]. It would be inappropriate to interpret these patterns as differing between languages, given the lack of any statistical difference (Wald Chi squared< 1), which cannot be attributed to a lack of power (minimum N=1,031 items)."
We note that, upon rereading the paper in the light of this uproar, we see something about the way we reported the tests of the individual languages that was not clear: These tests of the QWERTY effect in the individual languages controlled for word length, letter frequency, and their interaction. Thus, they correspond to the omnibus analysis in the paragraph that immediately follows them (which, as stated, controls for Word length, Letter frequency, and their interaction), and not to the omnibus analysis in the paragraph that immediately precedes them, on the uncontrolled data.
We apologize for any confusion this may have caused. Uncontrolled simple regression results for each language are reported here, above, in figs. 1b-d. The differences between the raw and controlled versions of these analyses are slight, and do not change how the results should be interpreted.
To reiterate, both Raw and Controlled omnibus analyses on the aggregated ANEW data are reported in the paper; controlled analyses of the individual languages were reported (for uncontrolled analyses on individual languages, see figs 1b-d, above). As noted in the paper, the omnibus analyses showed no difference in the magnitude of the QWERTY effect across languages. As such, separate analyses of the individual languages were not licensed by the omnibus test. We reported the most carefully controlled (and therefore most clearly interpretable) version of these tests anyway, because we had an a priori hypothesis about the direction of the effects, and for the sake of full disclosure.
c. Liberman insinuates that, in some unspecified way, our paper might
be susceptible to the kinds of statistical errors recently blasted in a
paper by Simmons et al. (2011) on "False Positive psychology." How??
The Simmons paper, useful in many ways, points to four "researcher degrees of freedom" that can lead to false positive results. From the Simmons paper:
Situation A: two dependent variables.
Situation B: addition of 10 more observations per cell.
Situation C: controlling for gender or interaction of gender with treatment.
Situation D: dropping (or not dropping) one of three conditions.
We'll address each of these briefly.
Situation A: two dependent variables.
Sometimes, authors collect multiple DVs of interest, or potentially of interest, and only report the one(s) that come out to be significant. We didn't do this.
Since we only had one dependent variable of interest (i.e., Valence) our study is immune to this problem.
But wait, you might say, how was this DV chosen? How do skeptics know that Valence was really the intended DV? We ask curious readers to please have a look at our previous research, some of which is cited in the QWERTY paper: In the past 3 years, we've published 5 other papers exploring how manual motor fluency and left-right space are related to Valence in language and thought.
It's worth noting that one of the commentators, Steve Kass, gets this point completely backwards. He wrote:
"The authors incidentally mention that the DANEW words were rated for several factors not addressed in the paper: arousal, concreteness, dominance, and imageability. The data is all in Appendix B [...] and it would be interesting to see if there's a QWERTY effect for any of these factors. It's hard not to wonder if the authors looked for one. Certainly the paper doesn't conform to all of the recommendations in the Psychological Science paper you mention."
Actually, we do exactly what Simmons et al.'s recommended (not because of their recommendation, of course -- their paper was published after our manuscript was submitted).
From Simmons, et al.'s list of recommendations:
"Authors must list all variables collected in a study. This requirement prevents researchers from reporting only a convenient subset of the many measures that were collected, allowing readers and reviewers to easily identify possible researcher degrees of freedom. Because authors are required to just list those variables rather than describe them in detail, this requirement increases the length of an article by only a few words per otherwise shrouded variable."
We never had any intention of analyzing words' arousal, concreteness, dominance, or imageability as a function of their RSA. We collected these variables to make DANEW comparable to the ANEW corpora in other languages.
If we had gone snooping around to see if there was some sort of "QWERTY effect" for these other variables as Mr. Kass recommends - or if we had started throwing them into our models without justification, just to see what they do - this would be committing exactly the sin that Simmons et al. are trying to warn researchers against.
Situation B: addition of 10 more observations per cell.
This is probably the most common of the experimental sins that Simmons et al. point out: Adding more subjects ad hoc until your effect becomes significant. We didn't do that.
Note that 4 of the corpora analyzed above were already published -- we didn't collect data from *any* subjects! So, those results are completely immune to this problem.
How about the 2 corpora we constructed ourselves, and collected ratings on? Liberman was particularly suspicious of our pseudoword word corpus. Maybe we just ran subjects until the effect became significant? Well, let's see what the methods in the paper say:
There were 1600 nonce words, and we ran exactly 800 subjects, each of whom was asked to rate 20 words, to yield a total of 16,000 data points. Wouldn't it be remarkable if we had ended up with exactly 10 times as many data points as items without having planned this ahead of time?
Situation C: controlling for gender or interaction of gender with treatment.
Sometimes, it's possible to make a non-significant effect appear significant by throwing irrelevant factors into the model until something comes out the way you predicted. We didn't do this.
Importantly, we began the Results section for each experiment by reporting the "raw" omnibus analysis, with one predictor variable (RSA) and one dependent measure (Valence). These raw analyses show that the basic effect is significant, even without controlling for other factors. Since this is true, the reader can be sure that our conclusions are not based on some strategic analysis.
We went on to control for Word Length, Letter Frequency, and their interaction. Controlling for length and frequency is easy to justify - these variables are controlled in nearly every psycholinguistic study ever run, and in this case, they are plausibly linked to both typing fluency and valence. (Imagine if we *hadn't* controlled for these variables - wouldn't any informed reviewer want to see at least some of these analyses with these controls added? Otherwise, how could we be sure that the QWERTY effect wasn't an artifact of words spelled with more letters on one side simply being longer or than words spelled with more letters on the other side, or having more frequent letters?)
We reported these controlled analyses, in addition to the raw uncontrolled analyses, in Expts 1 and 2. We reported only the raw analysis in Expt 3, due to reduce length and redundancy in this brief report. The predicted effect was highly significant in the raw analysis (see paper), and even stronger in the analysis controlling for Word Length, Letter Frequency, and their interaction ([B=0.056, Wald Chi squared=37.02, df=1, p=0.0001].
Situation D: dropping (or not dropping) one of [three] conditions.
If you test for effects of 2 or more independent variables, and report only the ones that have a significant effect on the DV, this is a serious source of Type I error. We didn't do that.
There was only one predictor variable of interest across all of our studies: RSA, so our study is immune to this problem. For each experiment, before reporting any more controlled analyses, we reported the effect of RSA on Valence with exactly one predictor in the model: RSA. For studies where handedness information was available, we reported effects of handedness, and effects of RSA controlling for handedness, even though this variable had no significant effect.
So, to summarize this point: Without offering any justification, Liberman insinuated that we had committed some sin(s) of data analysis that Simmons et al. were trying to raise researchers' awareness of. This insinuation was not only unsupported, it is also unsupportable.
4. Liberman posted a "failure to replicate" the QWERTY effect in a
large but peculiar corpus of English "words," submitted by the
researcher who constructed the corpus (Dodds).
The short version of our reply to this "failure to replicate" is: If you analyze the Dodds corpus in a way that's comparable to the way we analyzed the corpora in our paper, it, too, shows a very small but significant QWERTY effect. As such, it's hard to see how this could count as a "failure to replicate" the QWERTY effect - in fact, the Dodds corpus provides yet another replication!
To back up for a moment, though, the Dodds corpus is huge and very interesting - we're happy to learn about it. But it's also very strange. As we mentioned above, Dodds et al. define a "word" as "any contiguous set of characters bounded by white space and/or a small set of punctuation characters." This means that their participants were asked to rate "how happy did you feel?" while reading so-called words like "-d=", "@addthis", "#mm", "#p2", "at;t", "c1", etc. They were also asked to rate their emotional responses to closed class words like "of" and "the," which seems quite different from rating the emotional content of a neutral-valence content word like "table."
How would you answer these questions?? Is analysing responses to "#ff" the same as analyzing our "textisms" from the AFINN corpus, like "LOL" or "wtf"? No, arguably it's not - these expressions have conventional meanings. Is it the same as asking people to guess the valence of pronounceable pseudowords like "pleek," which have the form of English content words, and which participants were told to imagine were [content] words "in an alien language"? Arguably, our pseudoword rating task is considerably less strange.
This is not intended as a critique of the Dodds corpus; our point is that the Dodds corpus defines "word" in such an unusual way, and therefore asks participants to perform such an unusual task, that we're not sure whether we would even predict that a QWERTY effect should be found for ratings on these "words." (e.g., We made no claims about the effects of non-letter characters on non-words' valences, nor about the effects of characters that require combinations of keys to produce, etc.)
Fortunately, there is a QWERTY effect in the Dodds corpus. Although the relationship is not evident in the uncontrolled analysis that Liberman reported, it is present when we use the same controls we used in our paper (i.e., controlling for Word Length, Letter Frequency, and their interaction, and analyzing effects for words composed of letters only (as Liberman does): B=.009, Wald Chi Squared = 4.52, p=.03).
So, is this the last word on how to analyse or interpret the QWERTY effect in the Dodds corpus? Probably not - this is an unusual corpus, and it raises some complicated issues. Moreover, any corpus is a sample from the population of All Words, and even reliable effects are likely to be found more strongly in some samples than in others. But the fact is, when we analyze this enormous corpus in a way that's the comparable to the controlled analyses we conducted previously, we find a very small but significant QWERTY effect. Arguably, then, this corpus does not produce a failure to replicate - on the contrary, it provides yet another replication.
CONCLUSIONS: Evidence for a robust effect and a hasty blogosphere
Let's summarize the tests of the QWERTY effect so far. In our paper, we reported planned tests of the QWERTY effect in six sets of words and in the relevant aggregate sets: English ANEW, Spanish ANEW, Dutch ANEW, 1600 Pseudowords, AFINN-Old, and AFINN-New. Tests on the aggregate data all showed highly significant QWERTY effects. 5 of the 6 tests on the individual corpora or subsets also produced significant QWERTY effects; the 6th test showed a trend in the predicted direction.
Subsequent to publishing this paper, we have replicated the effect again decisively in a new corpus, Portuguese ANEW, and also in our reanalysis of the 2178 unique words in AFINN (words that did not overlap with ANEW).
All of these effects - from 10 tests of the QWERTY effect - are visible in simple regressions on raw data, controlling for nothing (see fig. 1a-j, above). 9 of the 10 tests yield significant p-values according to permutation tests (10,000 iterations).
We also replicated the QWERTY effect weakly but significantly in the Dodds et al. corpus, with appropriate exclusions and controls.
All told, these 11 tests of the QWERTY effect reveal a subtle but reliable relationship between the way words are typed on the QWERTY keyboard and their emotional valences. This relationship may be surprising (and apparently upsetting) to some people. It is less surprising to us, since our predictions regarding the overall Right Side Advantage followed from numerous studies we have conducted in recent years exploring how motor fluency and left-right space are associated with emotional valence in language and thought.
All of the materials needed to replicate or extend our experiments are available online. We hope that researchers will explore this effect further, as we are doing - not in the hasty and counterproductive way that we've seen on the Language Log, but rather as scientists interested in contributing to the scientific record through careful analyses, vetted in peer review.
We note that, as Liberman pointed out, there was a typo in our paper: The letter "y" listed among the left-hand letters should have been a letter "v." This typo occurred in the manuscript (and in a published conference proceedings previously), but did not affect our analyses or results. We will ask the journal to publish an erratum to correct this 1-letter typo.
What lesson should we take away from the frenzied activity this paper and Liberman's post about it generated on the Language Log in the past week (and on other linguistics blogs)? The lesson is certainly not that the QWERTY effect is a fluke - the effects are small (as expected), but they are clearly reliable.
Rather, there seems to be an emerging lesson about the danger of attempting to engage in scientific discourse - and presenting new data or new analyses - in a forum with no oversight, and none of the measures of control that the publication process normally provides. Peer review is far from perfect, but as the past week on the Language Log has demonstrated, it's a lot better than the alternative.
Hopefully, if submitted to peer review, a nonsensical analysis like Liberman's 3-iteration permutation test (interpreted backwards) would never have been published, in any form. The fact that this meaningless analysis was published in the form in which it appeared has had real consequences - other eminent scholars have taken Liberman's analyses as being valid - in fact, they have apparently taken them to be more valid than the ones in the paper - they have reported his "results" on their blogs, and have condemned our study because of them (e.g., see Geoff Pullum's post on Lingua Franca from March 14, 2012).
We have demonstrated here that the claims we made in our paper are well supported by the data, and that hasty re-analyses of our data on Language Log are uninterpretable. Yet, this does not change the fact that Liberman (and others who've taken him at his word) have published their critiques which, despite being almost totally unsupported, make potentially career-damaging allegations.
We hope that Scientist-Bloggers like Liberman will attempt to separate their roles of commentators on science from their roles as contributors to scientific discourse, and to the analysis of scientific data. Commentary may be fast and loose, sensationalized for entertainment value, and at the discretion of the commentator. Science should be more careful, and is not a solo act. If Liberman had gone through ordinary scientific channels before publishing his "findings" (e.g., contacting the authors to ask for materials, or to discuss an analysis that he believed to be at variance with their findings; submitting a legitimate critique to the journal for peer review), then this whole episode could have been avoided - saving time and public embarrassment for the blogger and the blogged, alike.
Daniel Casasanto and Kyle Jasmin
16 March, 2012